BSA 42 | Britain's democracy
The National Centre for Social Research (NatCen)'s annual British Social Attitudes (BSA) survey asks a representative sample of the population what it's like to live in Britain and what they think about how Britain is run. Since 1983 we have been measuring and tracking changes in people's social, political and moral attitudes.
The survey is a critical gauge of public opinion, and is used by government, NGOs, journalists, opinion formers and academics.
British Social Attitudes is the National Centre for Social Research’s flagship study tracking social and political attitudes. The study began in 1983 and has been conducted every year since, except in 1988 and 1992 when funding was devoted instead to studies of voting behaviour and political attitudes in the British Election Study.
As a result of its longevity and regularly asking a representative sample of people their views on a wide range of topics, the survey is the 'gold standard' of survey series. Random probability sampling ensures that everyone has an equal chance of being picked to take part, so the results are representative of the British population.
We repeat many of the same questions over time, tracking attitudes and views towards everything from abortion, public spending, the NHS, taxation, the monarchy and more. Collecting this data over the years allows us to track notable trends where views have changed or stayed the same in Britain.
British Social Attitudes is run by the National Centre for Social Research (NatCen) and is made possible by the funding we receive from a variety of charitable and governmental sources each year.
This year, the survey is funded by the Department for Levelling Up, Housing and Communities, the Department for Work and Pensions, the Economic and Social Research Council, King’s Fund and Nuffield Trust.
You can fund anywhere from 5 to 50 questions on the survey with a sample of between 1,000 and 3,000 people. You can also access more than 40 years’ worth of trend data, an array of demographics and have the opportunity to be part of the British Social Attitudes report.
If you are interested in funding some of the BSA questions, please contact a member of the BSA team at BSA@natcen.ac.uk.
The British Social Attitudes survey has been tracking key policy and social issues since 1983. These are just a few examples of how public opinion, and the British Social Attitudes survey in particular, has interacted with policy over the years.
BSA data from 2022/23 reported that satisfaction with the NHS had fallen to 29 per cent, the lowest level of satisfaction since the survey began. The UK Government has since published its mandate, promising to cut waiting times and to improve patient access to primary care.
Opposition to same-sex relationships peaked around the time of the HIV/AIDS scare in the mid-1980s. BSA showed that public attitudes then changed dramatically over the next 30 years. As attitudes changes, so government legislation has followed. In 2000 the proportion of people saying that sex between two adults of the same sex is wrong fell below 50% for the first time. We subsequently saw Labour pass legislation that lowered the age of consent from 18 to 16 (2000) and introduced civil partnerships (2004). By 2014 those opposed to same-sex relationships dropped to well under 30%. The same year, the Coalition government legalised same-sex marriage. By 2021, the proportion who were opposed had fallen to 13%.
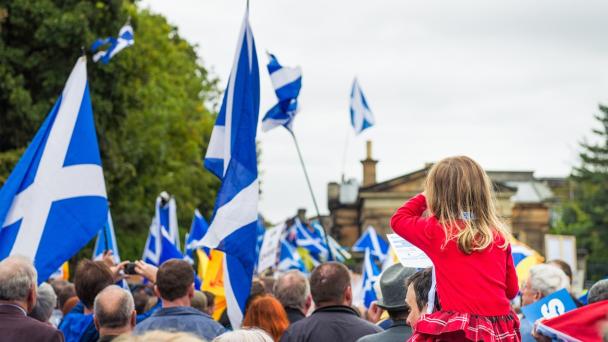
British Social Attitudes and its partner survey Scottish Social Attitudes were instrumental in providing impartial information about public attitudes during the campaign leading up to the referendum on Scottish Independence. They allowed us to understand the motivations of voters in Scotland and the likely reactions of the public in England and Wales. The Yes and No campaigns drew on the findings in shaping their campaigns as it became clear from our data that the potential impact of independence on the Scottish economy was the overriding factor in people’s voting intentions.
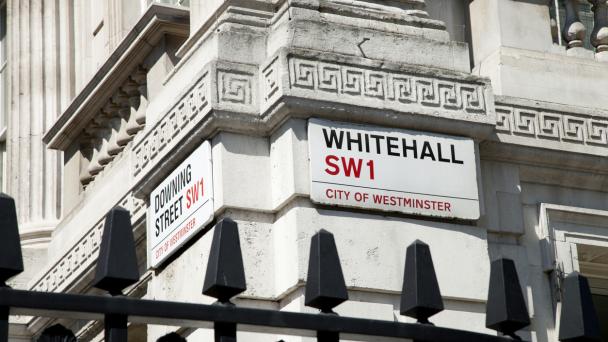
British Social Attitudes has been tracking public trust in government since 1986 and has shown a steady decline, with the biggest falls coinciding with government scandals, including the cash for questions affair in 1994 and the expenses scandal in 2009. Numerous attempts have been made by successive governments to reverse this decline, but nothing has been successful to date. In 2013 only 17% of people trust the government to put the needs of the country ahead of their party; the figure stood at 20% in 2017.
British Social Attitudes has shown consistent support since 1983 for a right to die for people with incurable and painful diseases, but also a strong view that doctors should take these decisions, not family members. This data was submitted as evidence to the House of Commons Health and Social Care Committee on assisted dying/assisted suicide in 2023. It is also regularly used by a number of organisations to campaign for compassionate assisted dying laws.
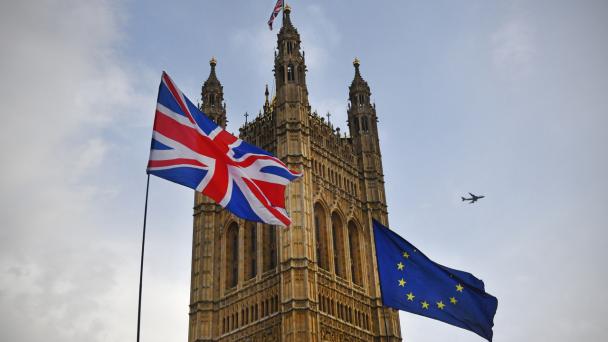
The 42nd British Social Attitudes (BSA) reports were published on 25 June 2025, as the Labour Government approaches one year in power. The latest data explores public opinion amidst the ongoing challenges of weak economic growth and struggling public services. We analyse trust in government and politicians since Labour’s election win, and the ‘health' of Britain’s democracy. BSA explores how public attitudes align with Labour’s policies for addressing the substantial challenges facing the UK, including public spending priorities and public services. The reports also look at the impact of social media on political attitudes, as well as public perspectives towards military spending, security and defence amid increasing global political shifts and international conflicts.
View British Social Attitudes reports from previous years. For archive or dataset requests, please email BSA@natcen.ac.uk.


 Event
Press release
Press release
Event
Press release
Press release